|
|
|||||||||||||||||||
|
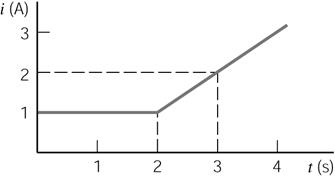
P1.2-7 Find the charge q(t) and sketch its waveform when the current
entering a terminal of an element is as shown in Figure P1.2-7. Assume that q(t) = 0 for t < 0. |
|||||||||||||||||||
|
|
|||||||||||||||||||
|
|
|||||||||||||||||||
|
Figure
P 1.2 – 7 |
|||||||||||||||||||
|
|
|||||||||||||||||||
|
We know that charge can be
found from |
|||||||||||||||||||
|
|
|||||||||||||||||||
|
|
|||||||||||||||||||
|
So we need to describe the
curve presented in the figure |
|||||||||||||||||||
|
|
|||||||||||||||||||
|
From 0 to 2 s, we have a
straight line |
|||||||||||||||||||
|
|
|||||||||||||||||||
|
|
|||||||||||||||||||
|
|
|||||||||||||||||||
|
|
|||||||||||||||||||
|
Solving |
|||||||||||||||||||
|
|
|||||||||||||||||||
|
Putting in the actual
variables |
|||||||||||||||||||
|
|
|||||||||||||||||||
|
|||||||||||||||||||
|
|
|||||||||||||||||||
|
For |
|||||||||||||||||||
|
|
|||||||||||||||||||
|
|
|||||||||||||||||||
|
|
|||||||||||||||||||
|
|
|||||||||||||||||||
|
Since we are told that q(t)
= 0 for t < 0 |
|||||||||||||||||||
|
|
|||||||||||||||||||
|
|
|||||||||||||||||||
|
At t = 2, |
|||||||||||||||||||
|
|
|||||||||||||||||||
|
|
|||||||||||||||||||
|
For |
|||||||||||||||||||
|
|
|||||||||||||||||||
|
|
|||||||||||||||||||
|
|
|||||||||||||||||||
|
|
|||||||||||||||||||
|
Check for |
|||||||||||||||||||
|
|
|||||||||||||||||||
|
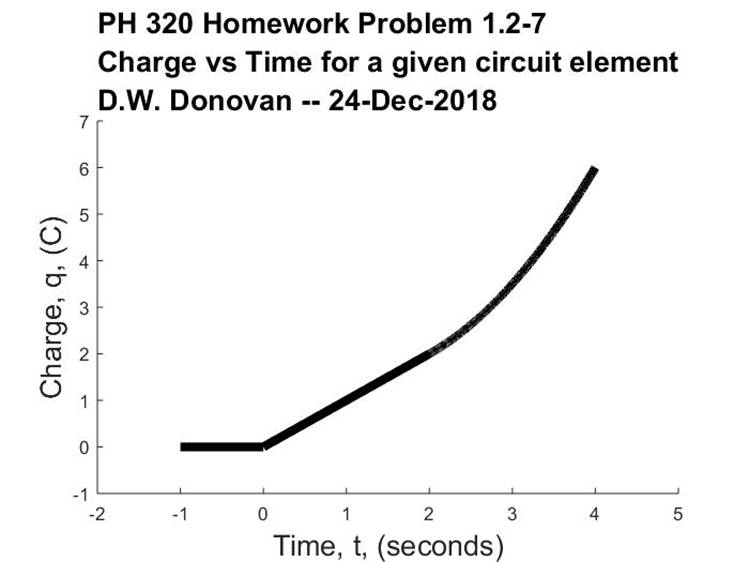
As it should be! So q(t) can be expressed as |
|||||||||||||||||||
|
|
|||||||||||||||||||
|
|||||||||||||||||||
|
|
|||||||||||||||||||
|
MATLAB Plots and Code follows: |
|||||||||||||||||||
|
|
|||||||||||||||||||
|
|
|||||||||||||||||||
|
|
|||||||||||||||||||
|
%Program
to plot out Current vs time for Homework Problem 1.2-7. %Version
2018-12-24 DW Donovan clear all; ta =
[-1:0.01:0]'; tb =
[0:0.01:2]'; tc =
[2:0.001:4]'; x = [ta' tb' tc']; qa = 0*ta; qb = tb; qc =
0.5*tc.^2-tc+2; y = [qa' qb' qc']; tt1 = 'PH 320
Homework Problem 1.2-7'; tt2 = 'Charge vs
Time for a given circuit element'; ttn = 'D.W.
Donovan -- '; tnl = '\newline'; ttf = [tt1 tnl tt2 tnl ttn
date]; |
|||||||||||||||||||
|
xl = 'Time, t,
(seconds)'; yl = 'Charge, q,
(C)'; sp = 1; axxmin = min(x)-sp; axxmax = max(x) + sp; axymin = min(y) - sp; axymax = max(y) + sp; figure hold on plot(ta, qa,'k-','LineWidth',5) plot(tb, qb,'k-','LineWidth',5) plot(tc, qc,'k-','LineWidth',5) title (ttf,'FontSize', 16) xlabel(xl, 'FontSize', 16) ylabel(yl, 'FontSize', 16) axis([axxmin axxmax axymin axymax]) |
|||||||||||||||||||
|
|
|||||||||||||||||||
|
|
|||||||||||||||||||
|
|||||||||||||||||||
|
|