|
|
|||||||||||||||||||
|
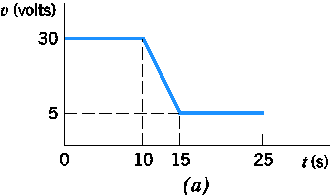
P 1.5-4 The current through and voltage across an element vary with time
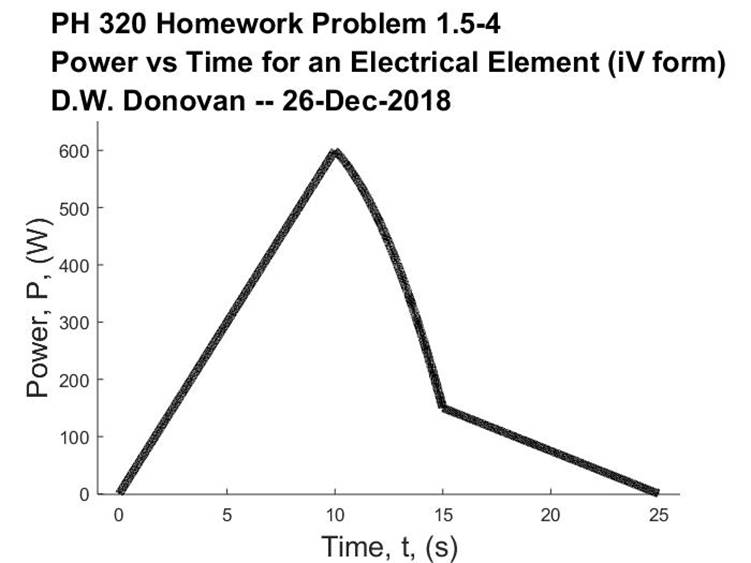
as shown in Figure P 1.5-4. Sketch the power delivered to the element for t > 0. What is the total energy
delivered to the element between t
= 0 and t = 25 s? The element
voltage and current adhere to the passive convention. |
|||||||||||||||||||
|
|
|||||||||||||||||||
|
|||||||||||||||||||
|
|
|||||||||||||||||||
|
Figure
P 1.5-4 |
|||||||||||||||||||
|
First we need to get equations from these two
graphs. As before, we will use two
point forms of lines. |
|||||||||||||||||||
|
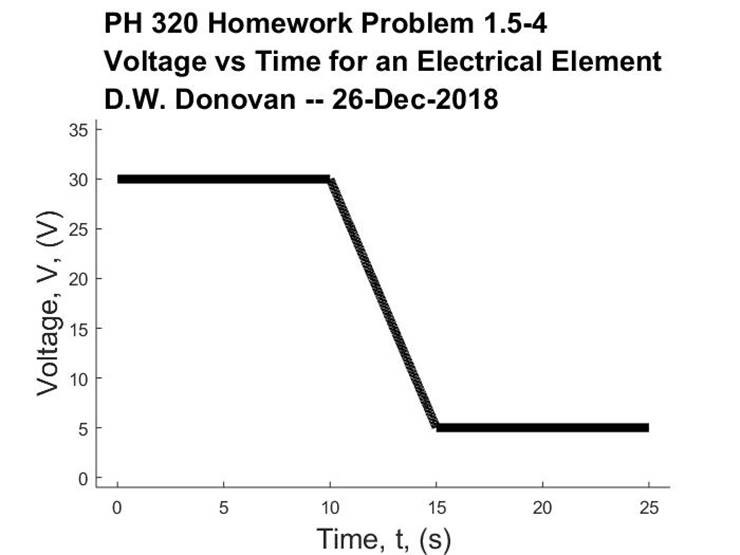
For the voltage curve we have
two flat lines so we already know |
|||||||||||||||||||
|
|
|||||||||||||||||||
|
|||||||||||||||||||
|
Need to get equation for
between 10 and 15 s. Use points (10,
30) and (15, 5) |
|||||||||||||||||||
|
|
|||||||||||||||||||
|
|
|||||||||||||||||||
|
|
|||||||||||||||||||
|
|
|||||||||||||||||||
|
|
|||||||||||||||||||
|
|
|||||||||||||||||||
|
Now get current. We have two lines use the three points
(0,0) (15, 30) and (25, 0) |
|||||||||||||||||||
|
|
|||||||||||||||||||
|
|
|||||||||||||||||||
|
For |
|||||||||||||||||||
|
|
|||||||||||||||||||
|
|
|||||||||||||||||||
|
For |
|||||||||||||||||||
|
|
|||||||||||||||||||
|
|
|||||||||||||||||||
|
So our equations are |
|||||||||||||||||||
|
|||||||||||||||||||
|
|
|||||||||||||||||||
|
Power is i(t)V(t) so we get |
|||||||||||||||||||
|
|
|||||||||||||||||||
|
|||||||||||||||||||
|
|
|||||||||||||||||||
|
We can plug these into MATLAB
and get the plot. To get the energy we
now use |
|||||||||||||||||||
|
|
|||||||||||||||||||
|
|
|||||||||||||||||||
|
|
|||||||||||||||||||
|
|
|||||||||||||||||||
|
|
|||||||||||||||||||
|
|
|||||||||||||||||||
|
|
|||||||||||||||||||
|
|
|||||||||||||||||||
|
|
|||||||||||||||||||
|
|
|||||||||||||||||||
|
|
|||||||||||||||||||
|
|
|||||||||||||||||||
|
|
|||||||||||||||||||
|
|
|||||||||||||||||||
|
|
|||||||||||||||||||
|
|
|||||||||||||||||||
|
|
|||||||||||||||||||
|
|
|||||||||||||||||||
|
|
|||||||||||||||||||
|
|
|||||||||||||||||||
|
|
|||||||||||||||||||
|
|
|||||||||||||||||||
|
|
|||||||||||||||||||
|
|||||||||||||||||||
|
|
|||||||||||||||||||
|
MATLAB Plots and Code follows: |
|||||||||||||||||||
|
|
|||||||||||||||||||
|
|
|||||||||||||||||||
|
|
|||||||||||||||||||
|
|
|||||||||||||||||||
|
|
|||||||||||||||||||
|
|
|||||||||||||||||||
|
|
|||||||||||||||||||
|
|
|||||||||||||||||||
|
|
|||||||||||||||||||
|
%Program
to plot out Current vs time for Homework Problem 1.5-4. %Version
2018-12-26 DW Donovan clear all; ta =
[1e-9:0.001:10]'; tb =
[10.00:0.001:15]'; tc =
[15.00:0.001:25]'; x = [ta' tb' tc']; Va = 30*ta./ta; Vb = -5*tb + 80; Vc= 5*tc./tc; Vy = [Va' Vb' Vc']; ia = 2*ta; ib = 2*tb; ic = -3*tc+75; iy =[ia' ib' ic']; |
|||||||||||||||||||
|
P1a = Va.*ia; P1b = Vb.*ib; P1c = Vc.*ic; P1y = [P1a'
P1b' P1c']; P2a = 60*ta; P2b =
-10*tb.^2 + 160*tb; P2c = -15*tc + 375; P2y = [P2a'
P2b' P2c']; %Energy
Calculation Ua =
P1a'*(ta./ta)*.001 Ub = P1b'*(tb./tb)*.001 Uc = P1c'*(tc./tc)*.001 Utot = Ua + Ub + Uc %{ Energy
Answers Ua =
2.9997e+03 Ub =
2.0837e+03 Uc =
750.0750 Utot =
5.8335e+03 %} % Plots tt1 = 'PH 320
Homework Problem 1.5-4'; ttn = 'D.W.
Donovan -- '; tnl = '\newline'; xl = 'Time, t,
(s)'; tt2a = 'Voltage vs
Time for an Electrical Element'; ttfa = [tt1 tnl tt2a tnl ttn date]; yla = 'Voltage, V,
(V)'; tt2b = 'Current vs
Time for an Electrical Element'; ttfb = [tt1 tnl tt2b tnl ttn date]; ylb = 'Current, i, (A)'; tt2c = 'Power vs
Time for an Electrical Element (iV form)'; ttfc = [tt1 tnl tt2c tnl ttn date]; ylc = 'Power, P,
(W)'; |
|||||||||||||||||||
|
|
|||||||||||||||||||
|
tt2d = 'Power vs
Time for an Electrical Element (P Eq Form)'; ttfd = [tt1 tnl tt2d tnl ttn date]; yld = 'Power, P,
(W)'; sp = 1; axxmin = min(x)-sp; axxmax = max(x) + sp; axyminV = min(Vy) - 5 - sp; axymaxV = max(Vy) + 5 + sp; axymini = min(iy) - sp; axymaxi = max(iy) + 5 + sp; axyminP1 =
min(P1y) - sp; axymaxP1 =
max(P1y) + 50 + sp; axyminP2 =
min(P2y) - sp; axymaxP2 =
max(P2y) + 50 + sp; figure hold on plot(ta, Va,'k-','LineWidth',5) plot(tb, Vb,'k-','LineWidth',5) plot(tc, Vc,'k-','LineWidth',5) title (ttfa,'FontSize', 16) xlabel(xl, 'FontSize', 16) ylabel(yla, 'FontSize', 16) axis([axxmin axxmax axyminV axymaxV]) figure hold on plot(ta, ia,'k-','LineWidth',5) plot(tb, ib,'k-','LineWidth',5) plot(tc, ic,'k-','LineWidth',5) title (ttfb,'FontSize', 16) xlabel(xl, 'FontSize', 16) ylabel(ylb, 'FontSize', 16) axis([axxmin axxmax axymini axymaxi]) figure hold on plot(ta, P1a,'k-','LineWidth',5) |
|||||||||||||||||||
|
|
|||||||||||||||||||
|
plot(tb, P1b,'k-','LineWidth',5) plot(tc, P1c,'k-','LineWidth',5) title (ttfc,'FontSize', 16) xlabel(xl, 'FontSize', 16) ylabel(ylc, 'FontSize', 16) axis([axxmin axxmax axyminP1
axymaxP1]) figure hold on plot(ta, P2a,'k-','LineWidth',5) plot(tb, P2b,'k-','LineWidth',5) plot(tc, P2c,'k-','LineWidth',5) title (ttfd,'FontSize', 16) xlabel(xl, 'FontSize', 16) ylabel(yld, 'FontSize', 16) axis([axxmin axxmax axyminP2
axymaxP2]) |
|||||||||||||||||||
|
|
|||||||||||||||||||
|
|
|||||||||||||||||||
|
|
|||||||||||||||||||
|
|||||||||||||||||||
|
|